Best practice
Choosing the right force field
The agreement between experiments and simulations can only be as good as the force field used in the simulations. Although it has been shown that some force fields lead to excellent agreement with experimental data, as for instance for water, hydrocarbons, or polymer melts [2, 18, 24], it is important to keep in mind that force fields are often parametrized to reproduce thermodynamic quantities, such as solvation energy. However, NMR relaxation times depend on both structural and dynamical quantities, and large differences between experiments and simulations are expected for poorly accurate force fields.
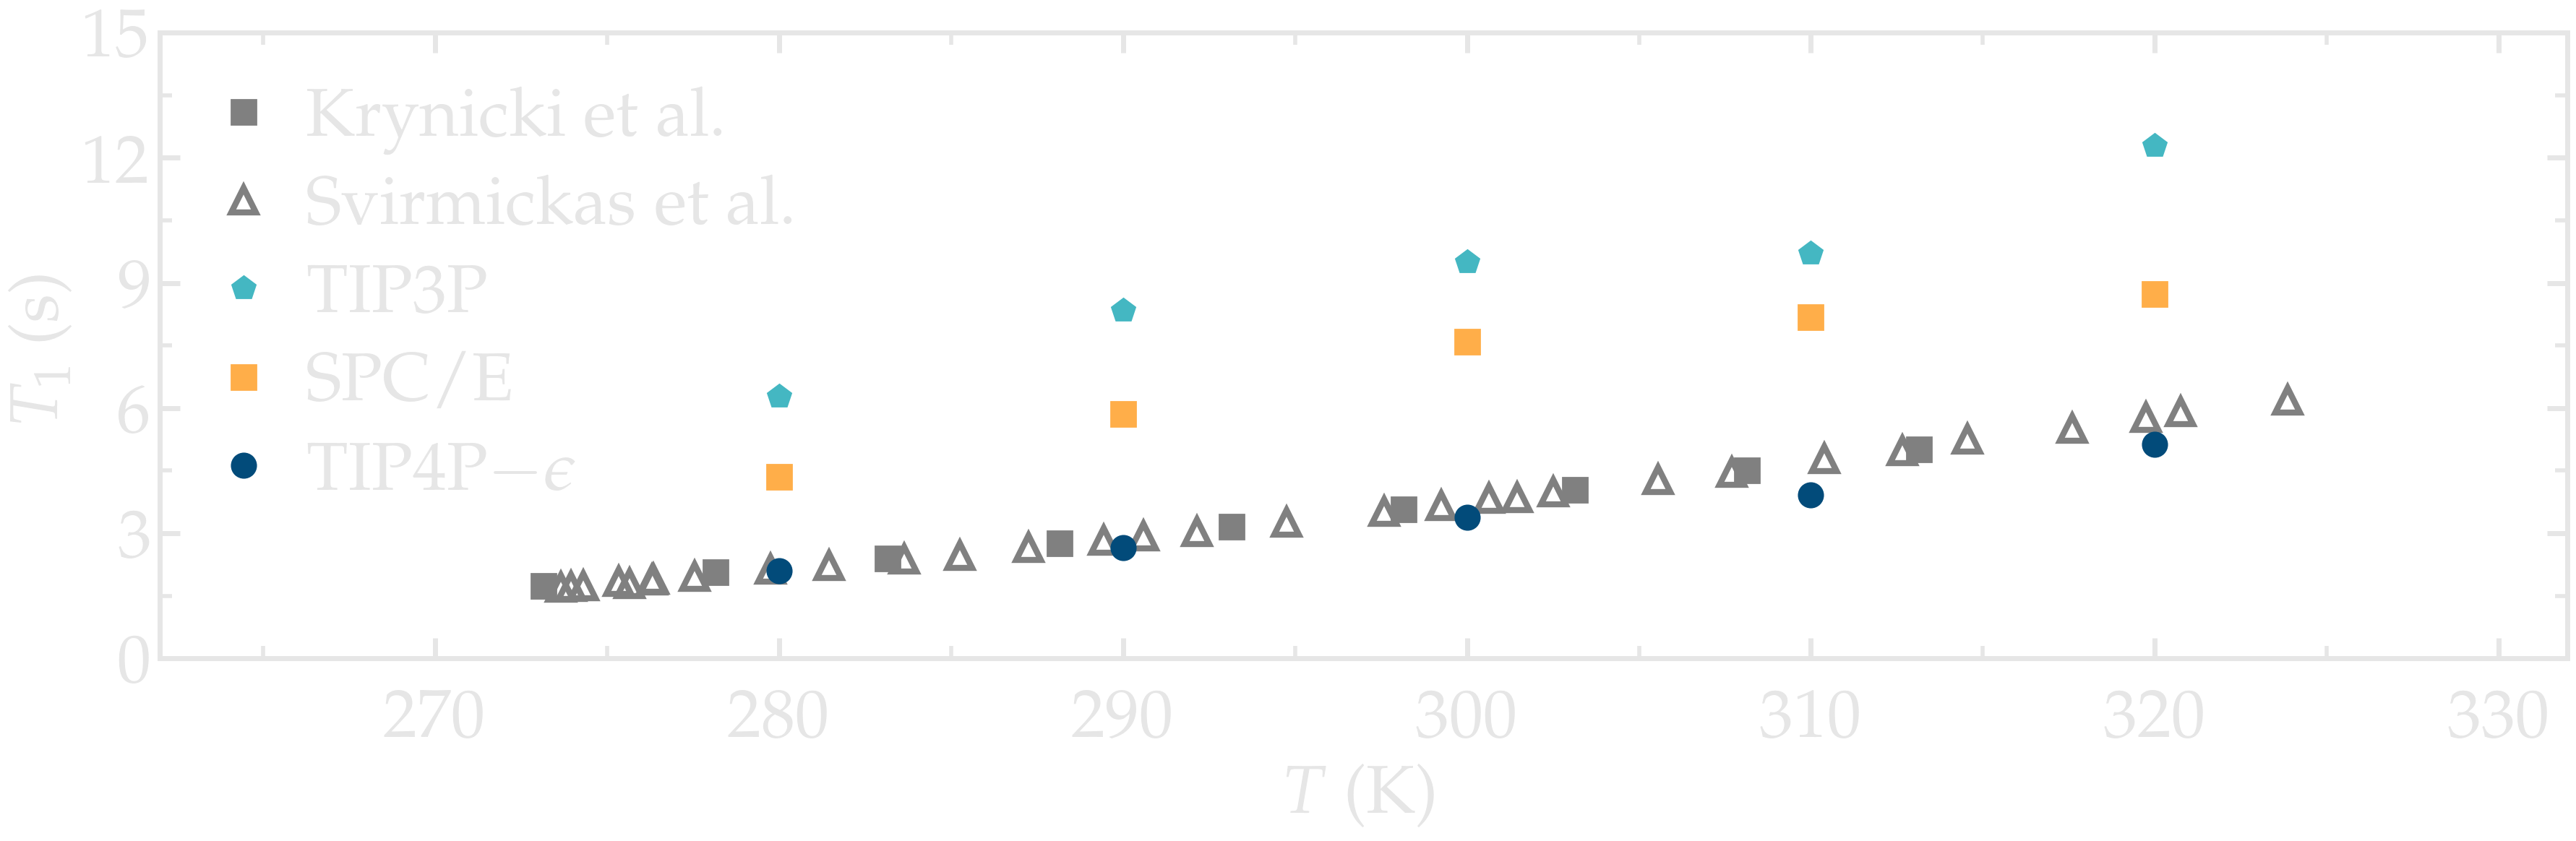
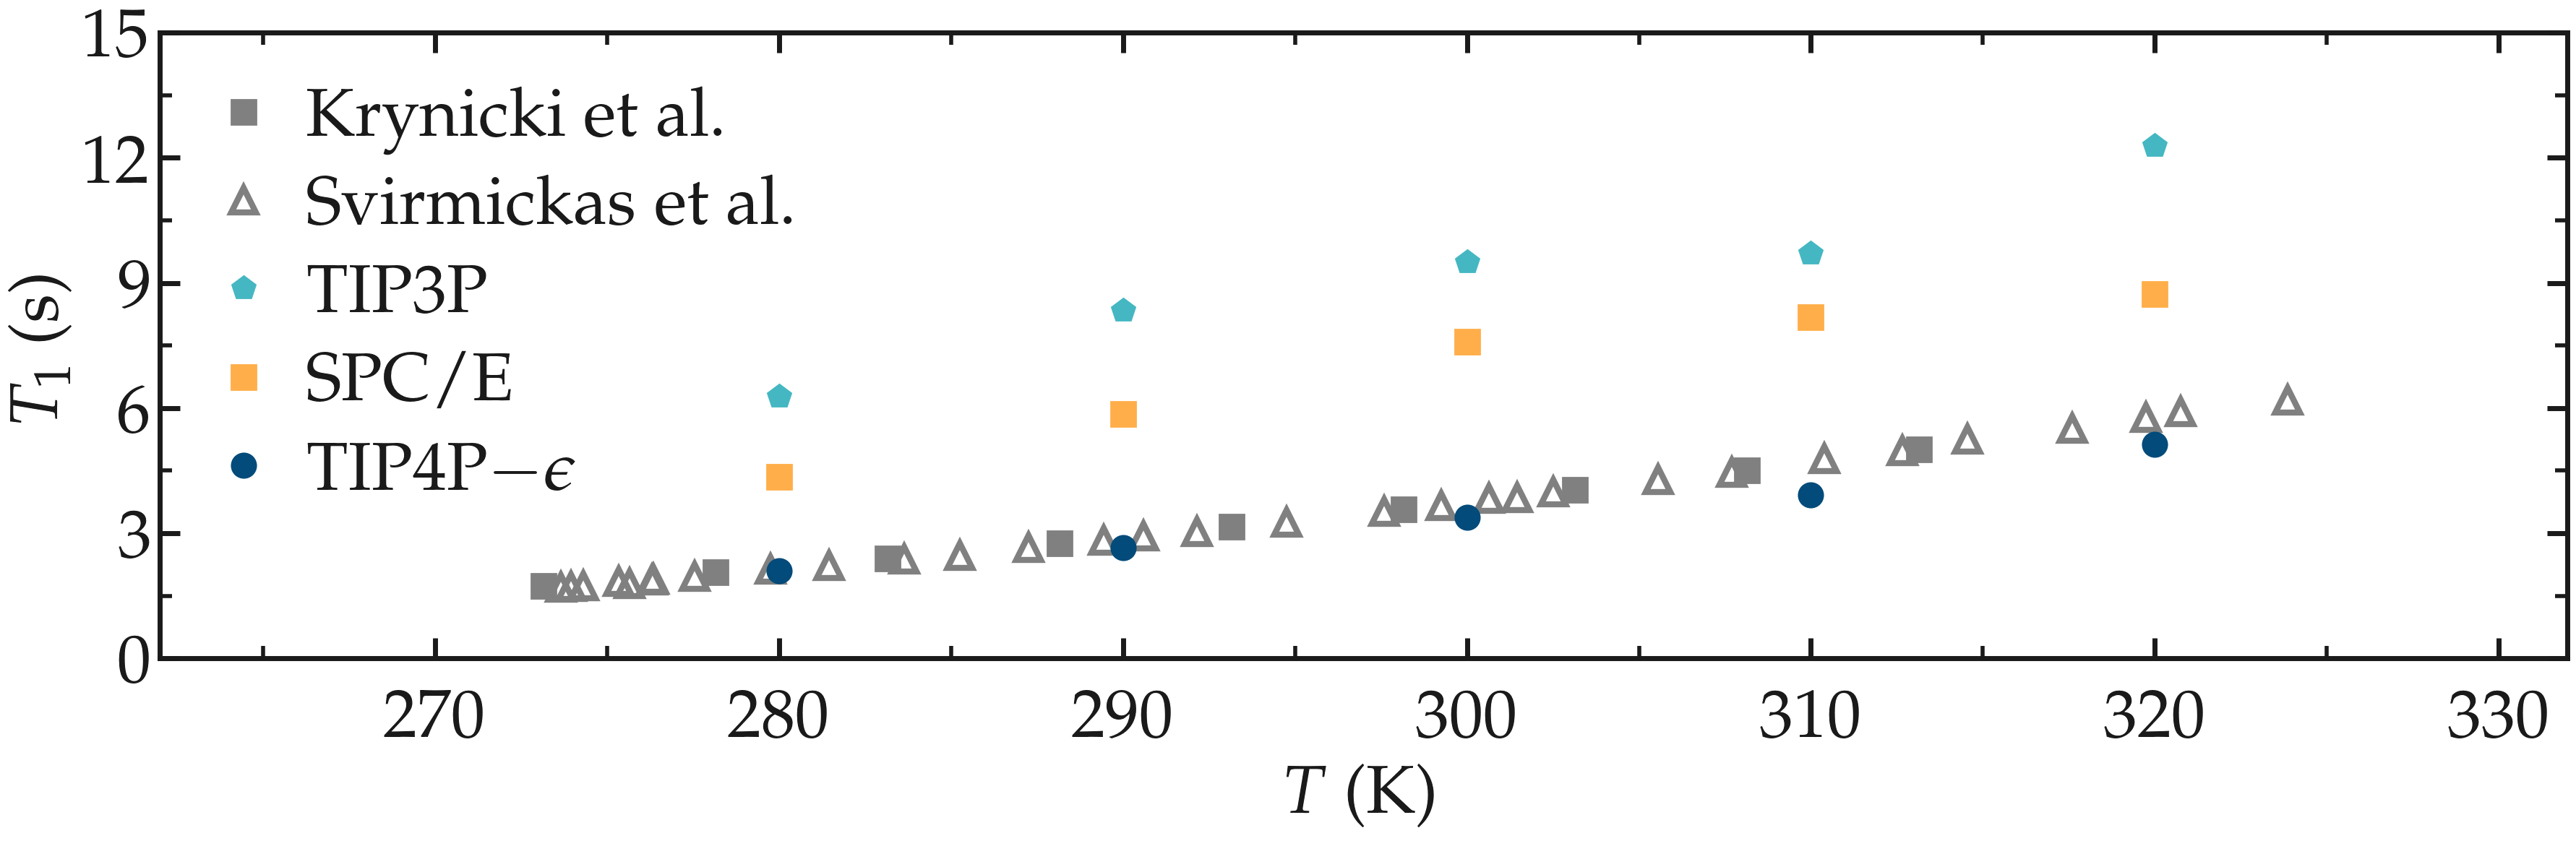
As an illustration, the NMR relaxation time \(T_1\) of bulk water was measured as a function of the temperature for three different water models: \(\text{TIP4P}-\epsilon\) [27], \(\text{SPC/E}\) [28], and \(\text{TIP3P}\) [29]. Our results show that the \(\text{TIP4P}-\epsilon\) water models is in excellent agreement with experimental measurements from Krynicki et al. [30] and Hindman et al. [31]. By contrast, \(\text{SPC/E}\) and \(\text{TIP3P}\) both overestimate the NMR relaxation time \(T_1\), in excellent agreement with previous results by Calero et al. [13]. Note that Calero et al. used \(\text{TIP4P}-2005\) water model instead of the \(\text{TIP4P}-\epsilon\) model used here, however these two models show very similar structures and viscosities for liquid water [27], and are thus expected to yield similar relaxation times.
Simulation accuracy
NMR relaxation measurements are sensitive both thermodynamic and dynamic quantities, and it is therefore important to ensure the accuracy of the molecular simulation. Several parameters are known to affect the accuracy of the simulations, such as the force field (as discussed previously), the time step, the cut-offs, or the sampling time [32, 33].
As an illustration, the NMR relaxation time \(T_1\) of bulk water was measured as a function of the LJ cut-off. Our results show that, for the smallest cut-off, the inter-molecular \(T_1^\text{inter}\) is slightly under-estimated, which is mainly due to an over-estimation of the inter-molecular characteristic time \(\tau_\text{inter}\). Our results also indicate that for a cut-off of 1,nm, which is commonly used value, a small error of about 1,% is induced. These observations are consistent with previous measurements [18], and confirm that care must be taken if one attempt in reproducing accurately NMR quantities.
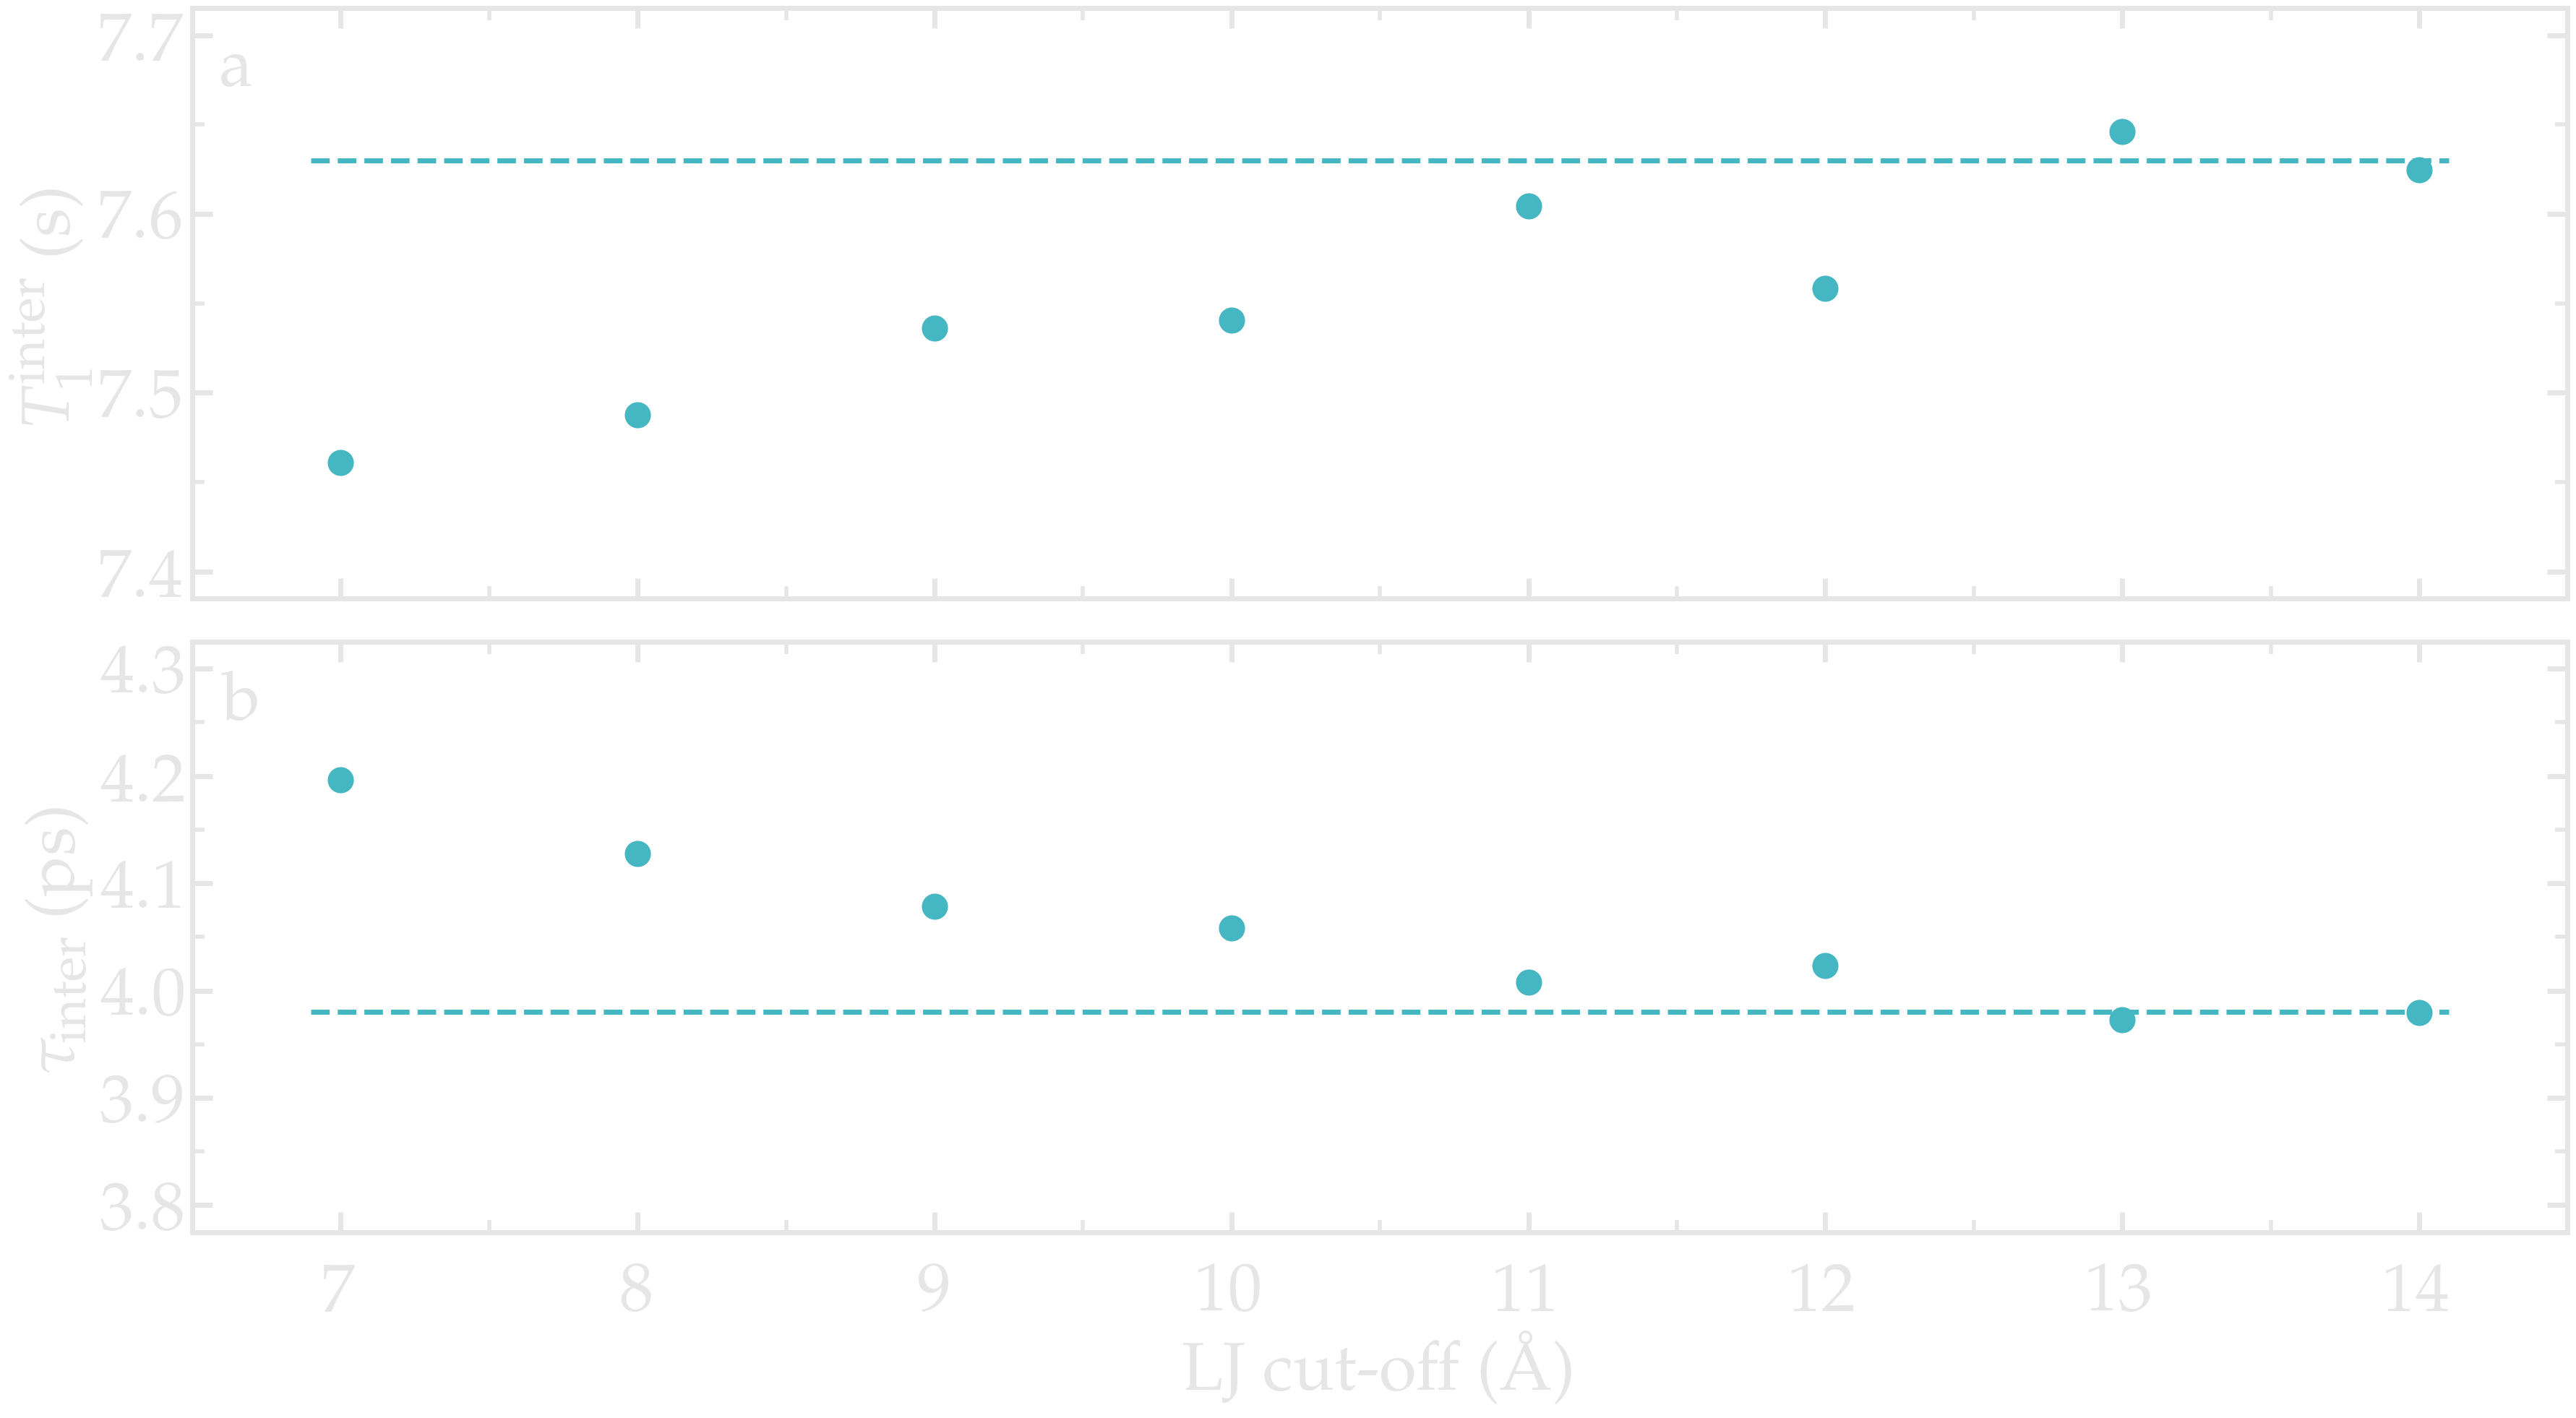
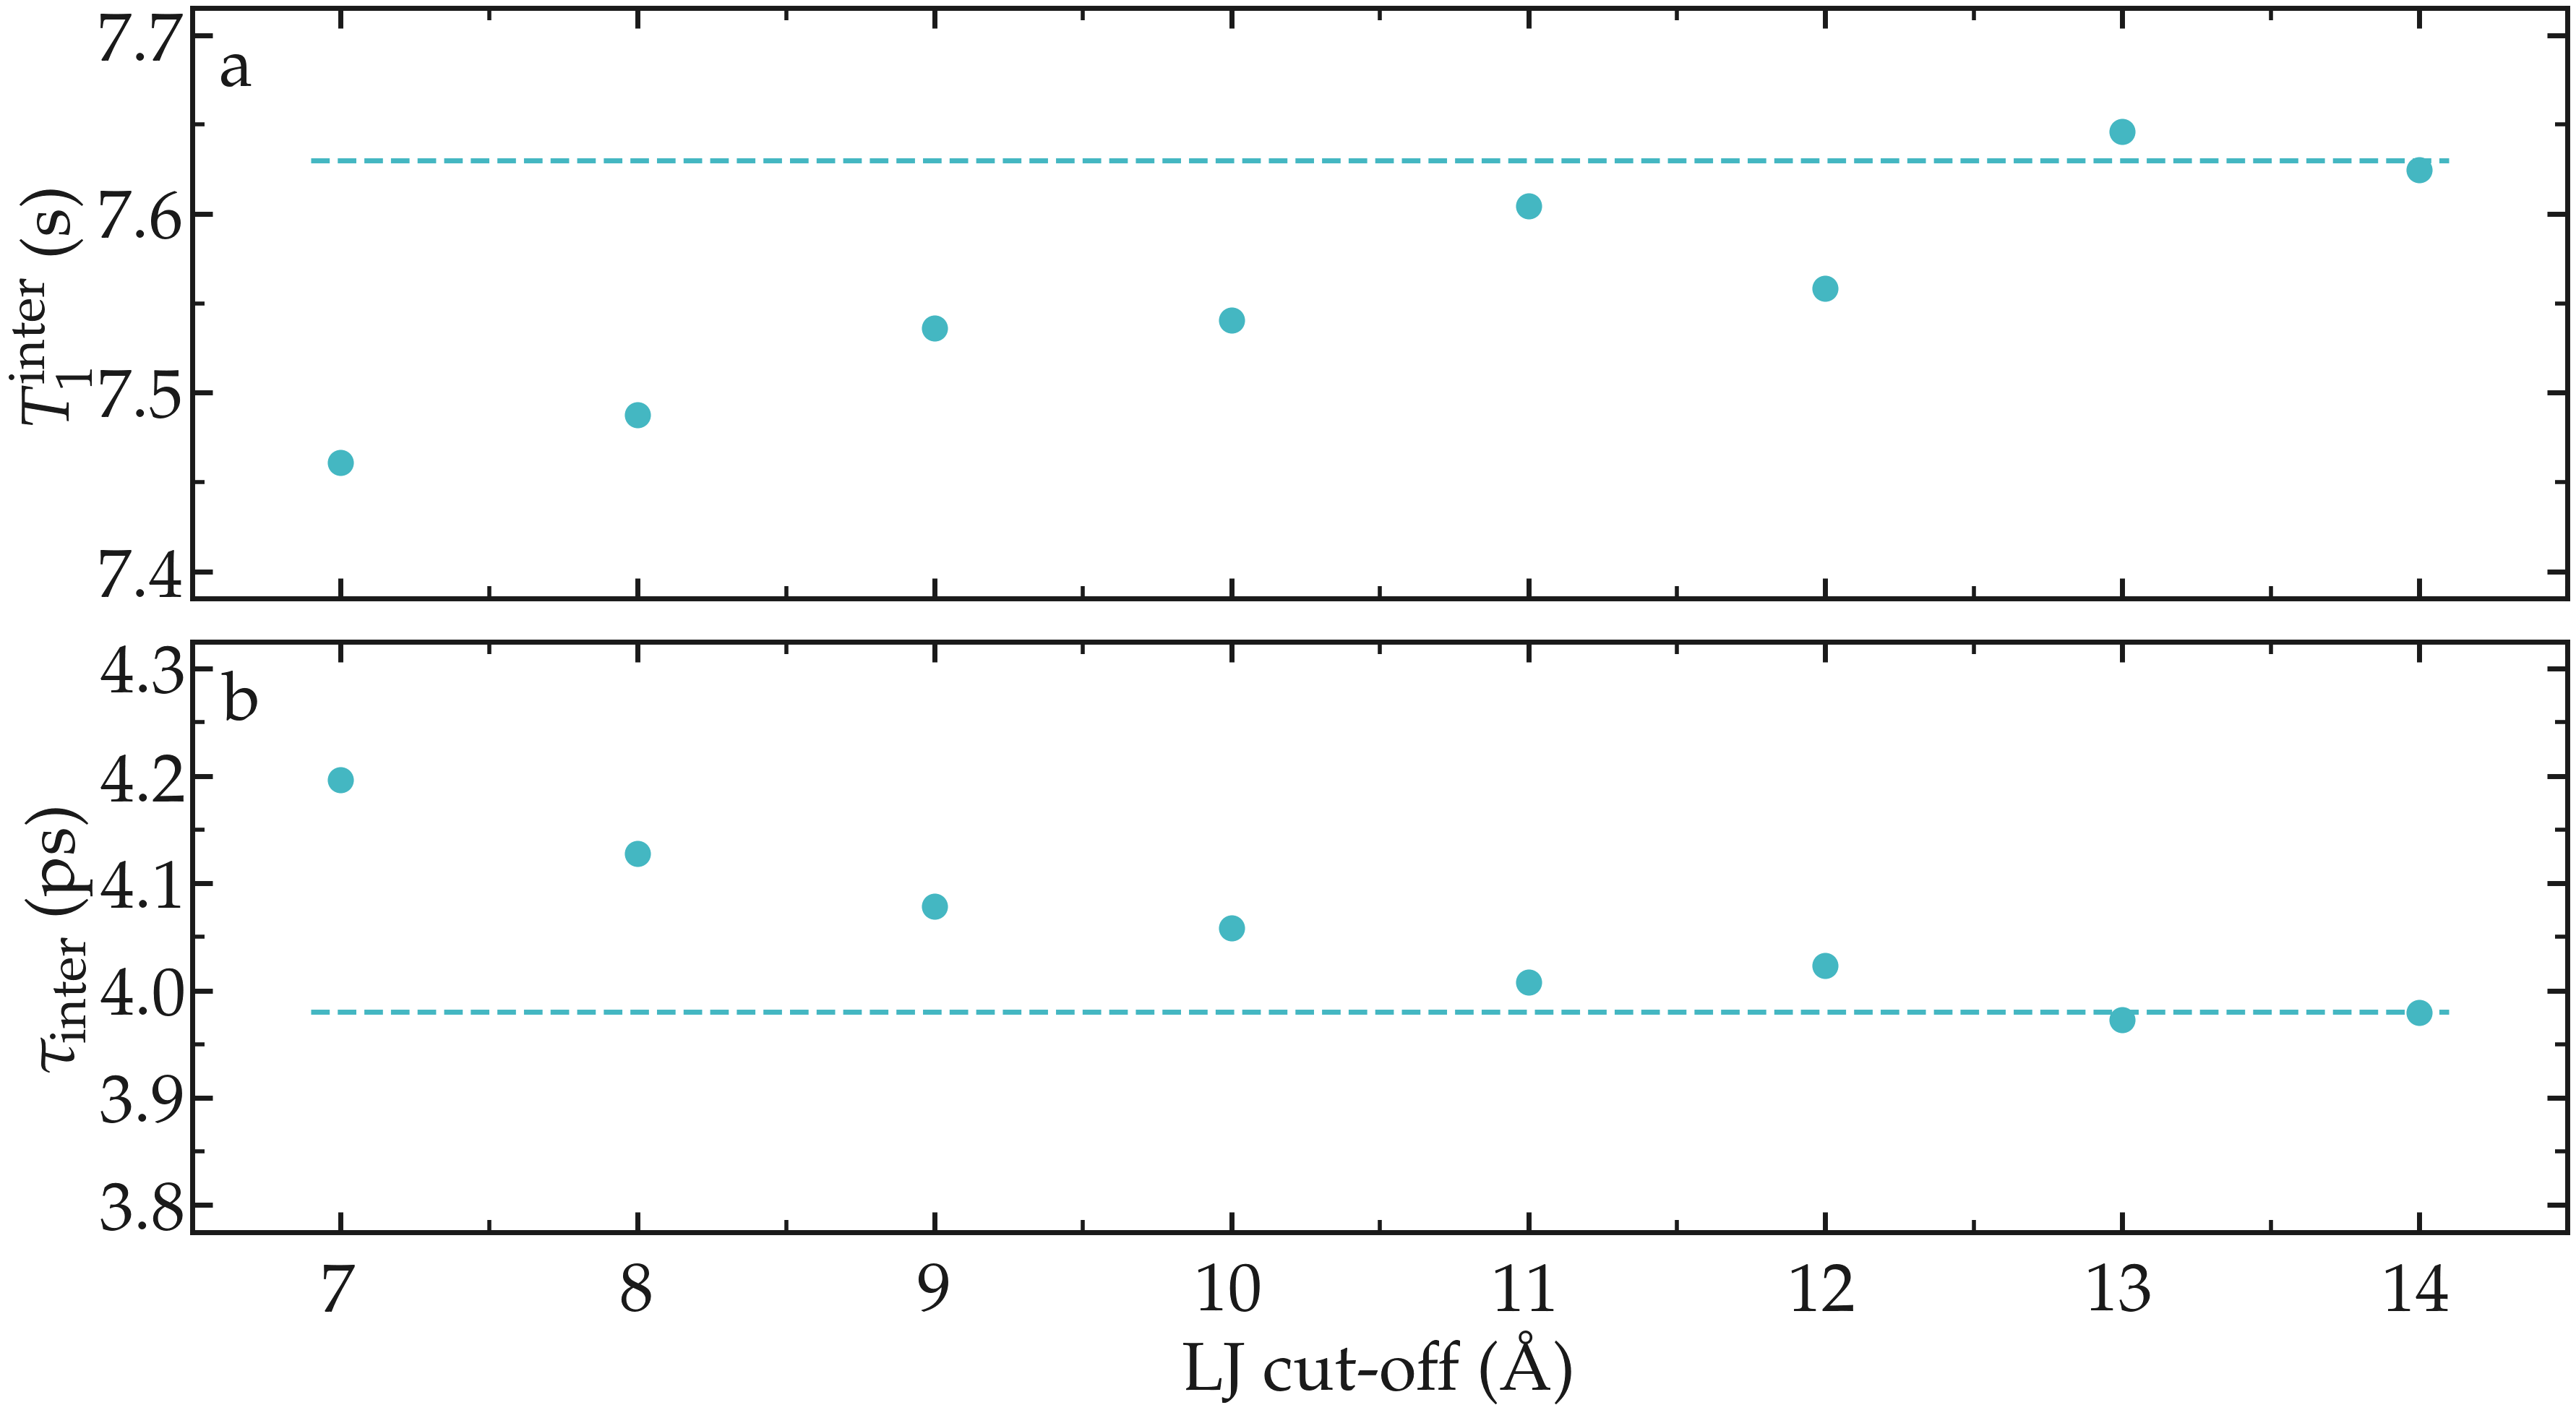
Figure: a) Inter-molecular NMR relaxation time \(T_1^\text{inter}\) as a function of the LJ cut-off for a bulk water system. b) Inter-molecular characteristic time \(\tau_\text{inter}\) as a function of LJ cut-off.
Box size
NMR relaxation measurements are sensitive to the finite-size effects that can occur with small simulation boxes [1].
As an illustration, the NMR relaxation rate \(R_1\) was measured for water with different number of molecules \(N \in [100,\,10000]\), which correspond to equilibrium box of lateral sizes \(L \in [1.4,\,6.7]\,\text{nm}\). Our results show that the inter-molecular relaxation rate \(R_1^\text{inter}\) is sensitive to the box size even for the largest boxes considered here. With small box size, the tail of \(G_\text{inter}\), which decreases as \(G_\text{inter} \sim t^{-3/2}\), is cutoff which lead to an error on \(R_1^\text{inter}\). Note that \(R_1^\text{intra}\), which is the dominant contribution to \(R_1\) for water at ambient temperature, is barely affected by the box size and therefore the resulting error induced on the total relaxation rate \(R_1\) remains small for \(N > 1000\).
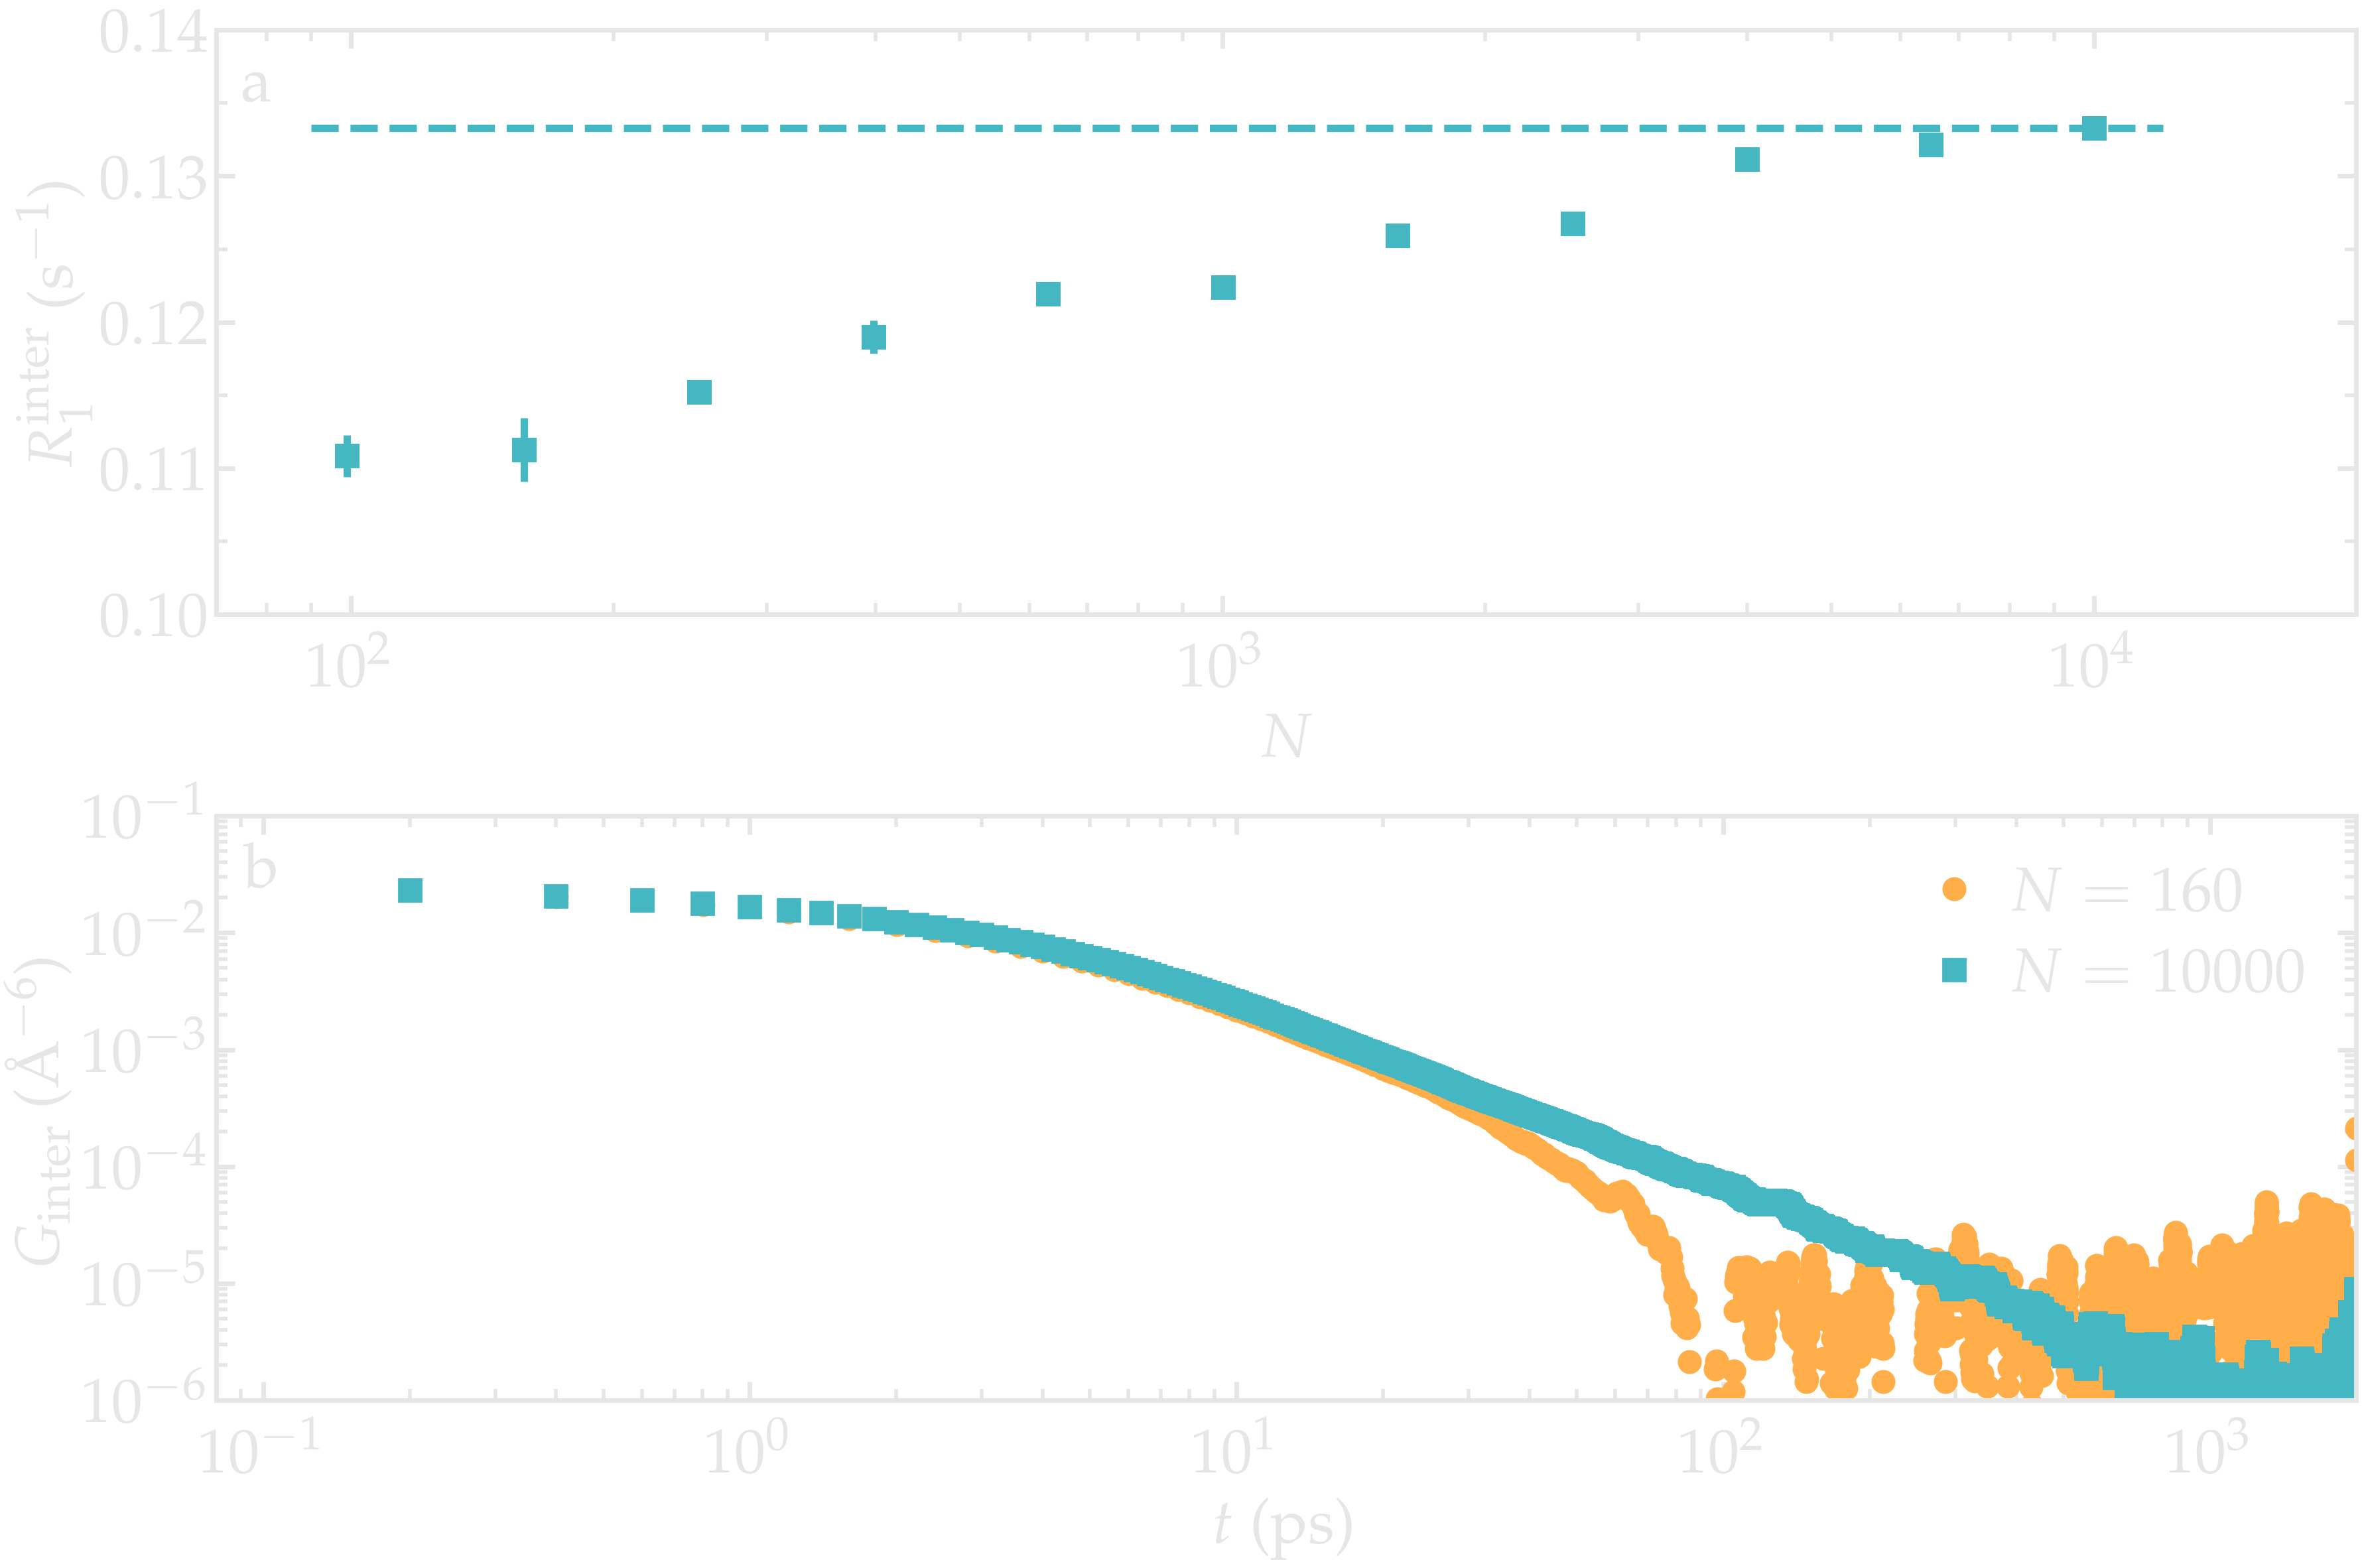
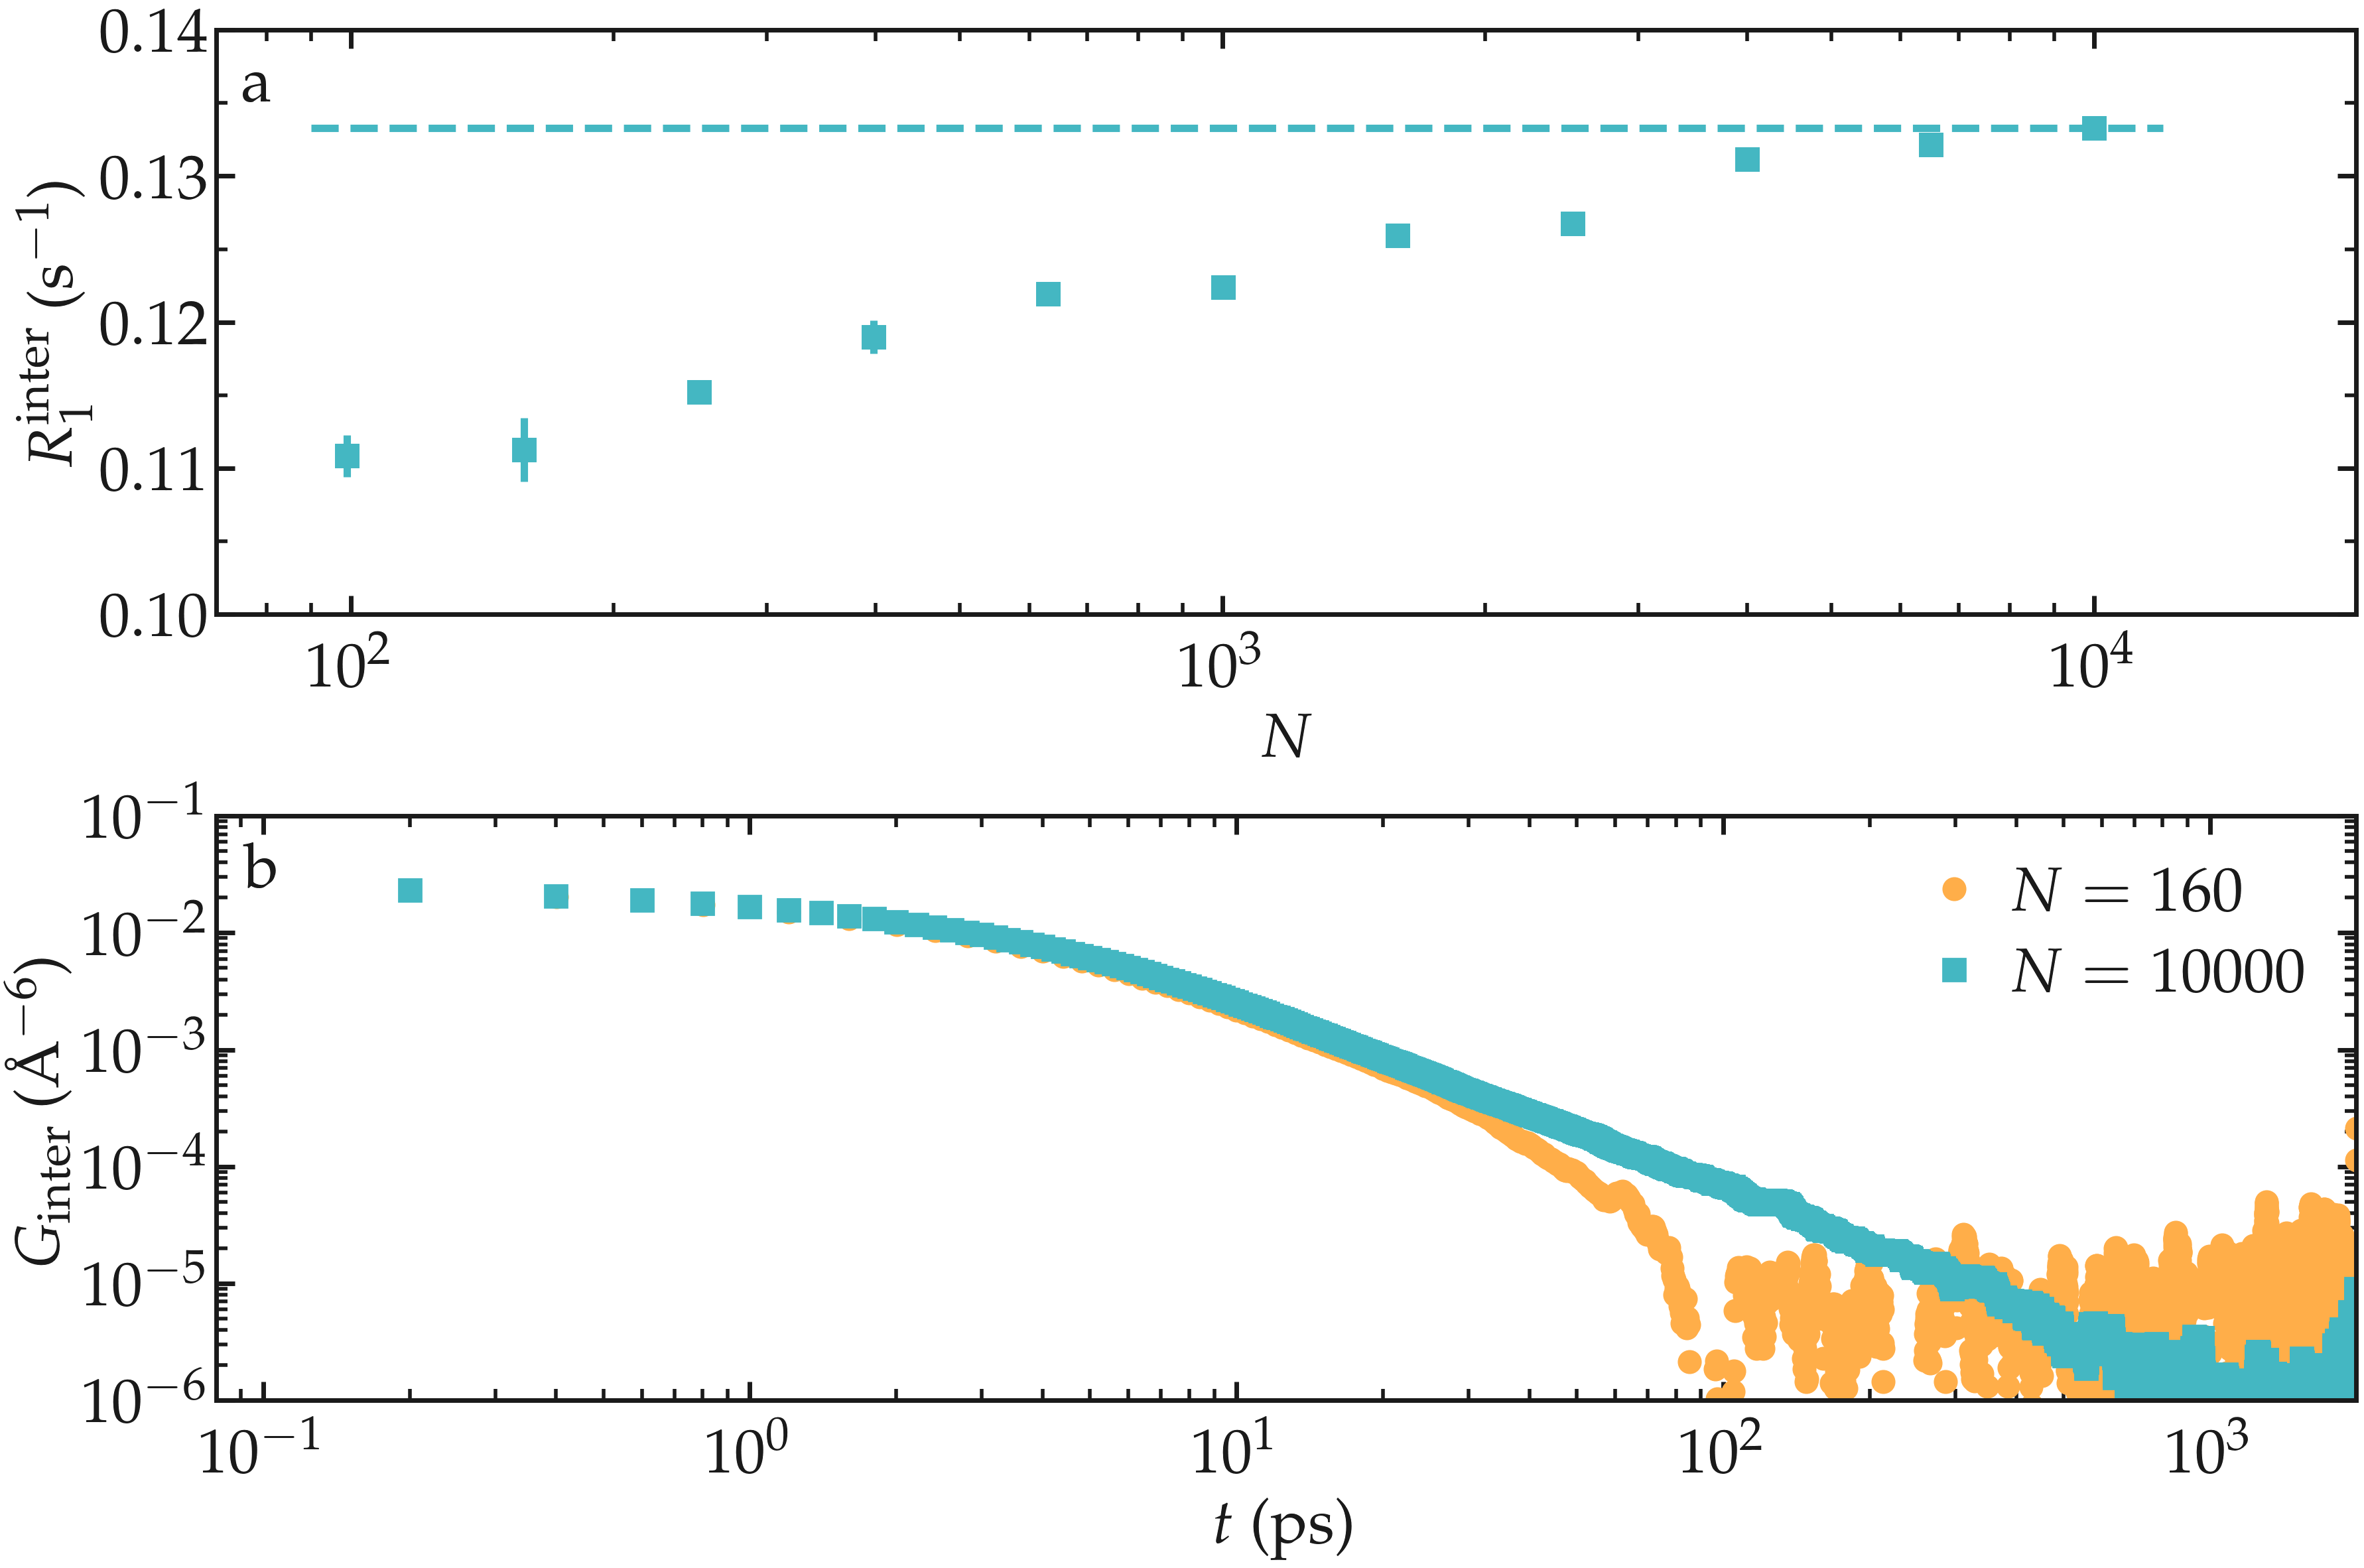
Figure: a) Inter-molecular NMR relaxation rate \(R_1^\text{inter}\) as a function of the number of molecules \(N\) for a bulk water system. For the smallest systems, results were averaged from up to 10 independent simulations and the error bar is calculated from the standard deviation. b) Inter-molecular correlation function \(G_\text{inter}\) for two different numbers of molecules.
Dumping frequency
The dumping frequency sets the temporal resolution of the analysis. The maximum dumping period that can be used is system-dependent and must typically be much smaller than the correlation times. If the typical correlation times in the system is not known, the appropriate dumping frequency \(\Delta t\) can be identified from convergence testing. Note however than using a high dumping frequency increases the size of the trajectory files, which in turn can make the computation of NMR relaxation rates computationally expensive.
As an illustration, the NMR relaxation time \(T_1\) was measured for an increasing dumping period from \(\Delta t = 0.02\,\text{ps}\) to \(5\,\text{ps}\). Our results show that using a dumping period larger than about \(\Delta t = 0.5\,\text{ps}\) leads to a significant decrease of the measured relaxation time \(T_1\). The decrease in \(T_1\) is accompanied by an increase of the measured inter-molecular relaxation times \(\tau_\text{inter}\).
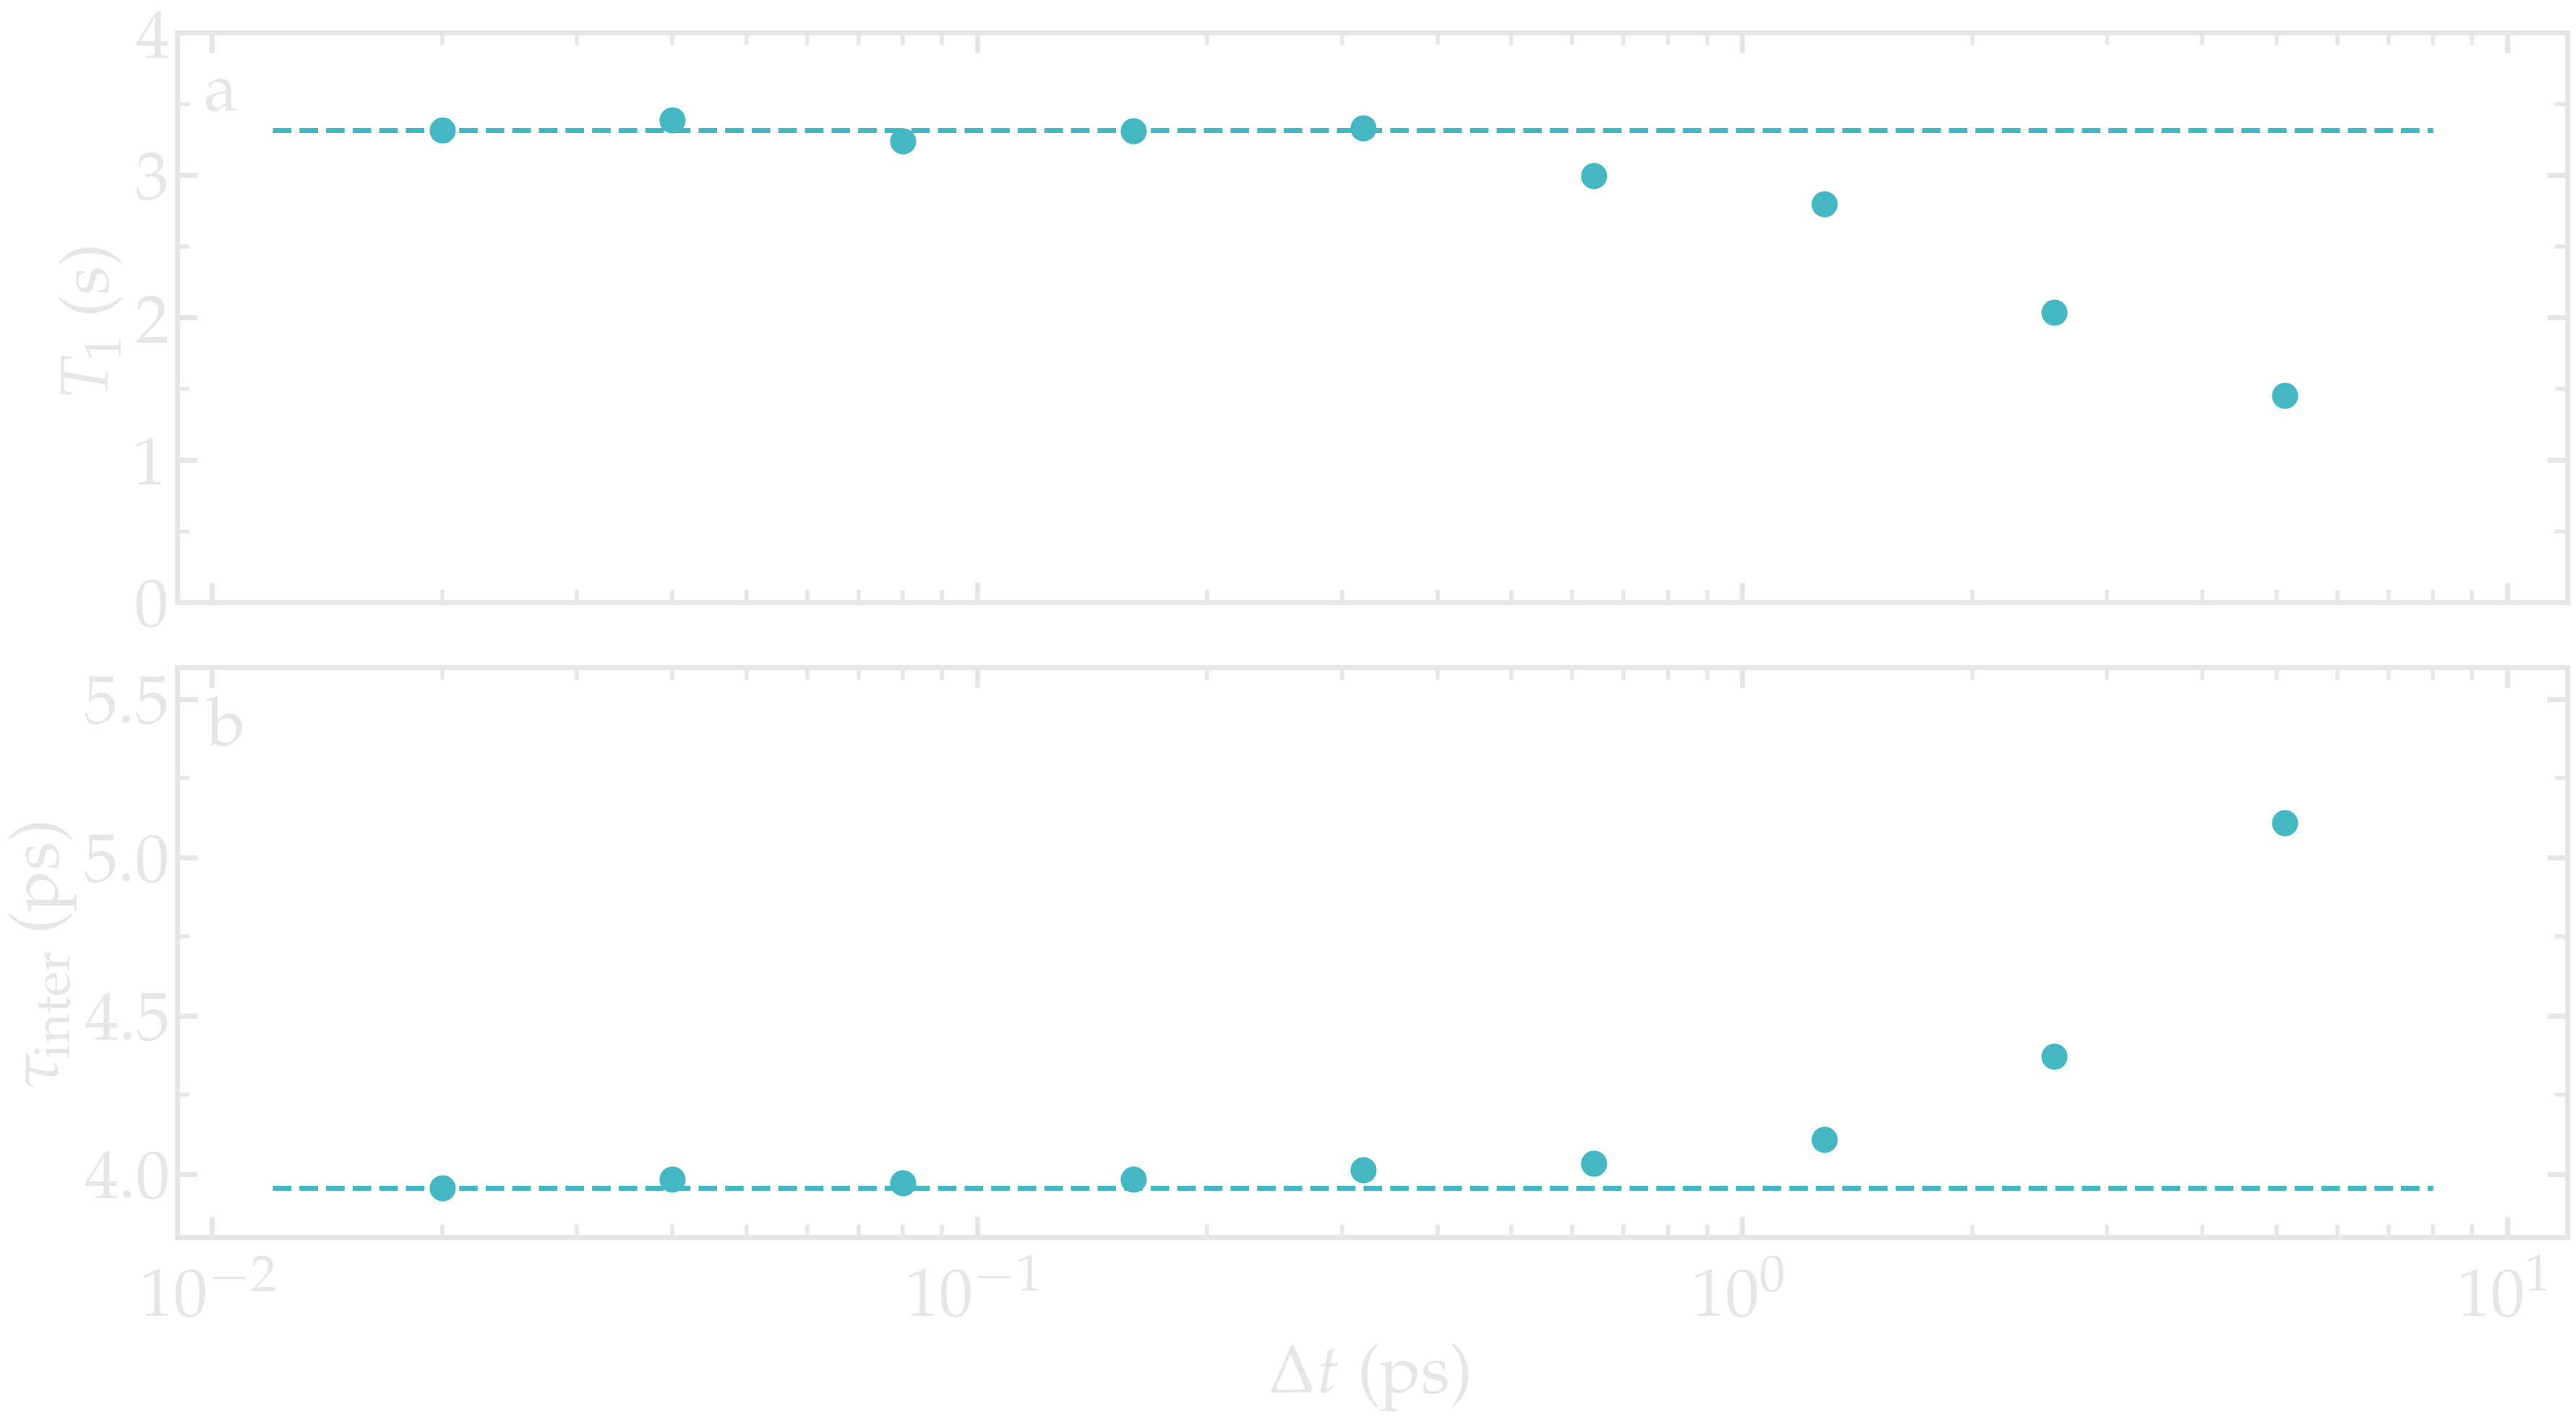
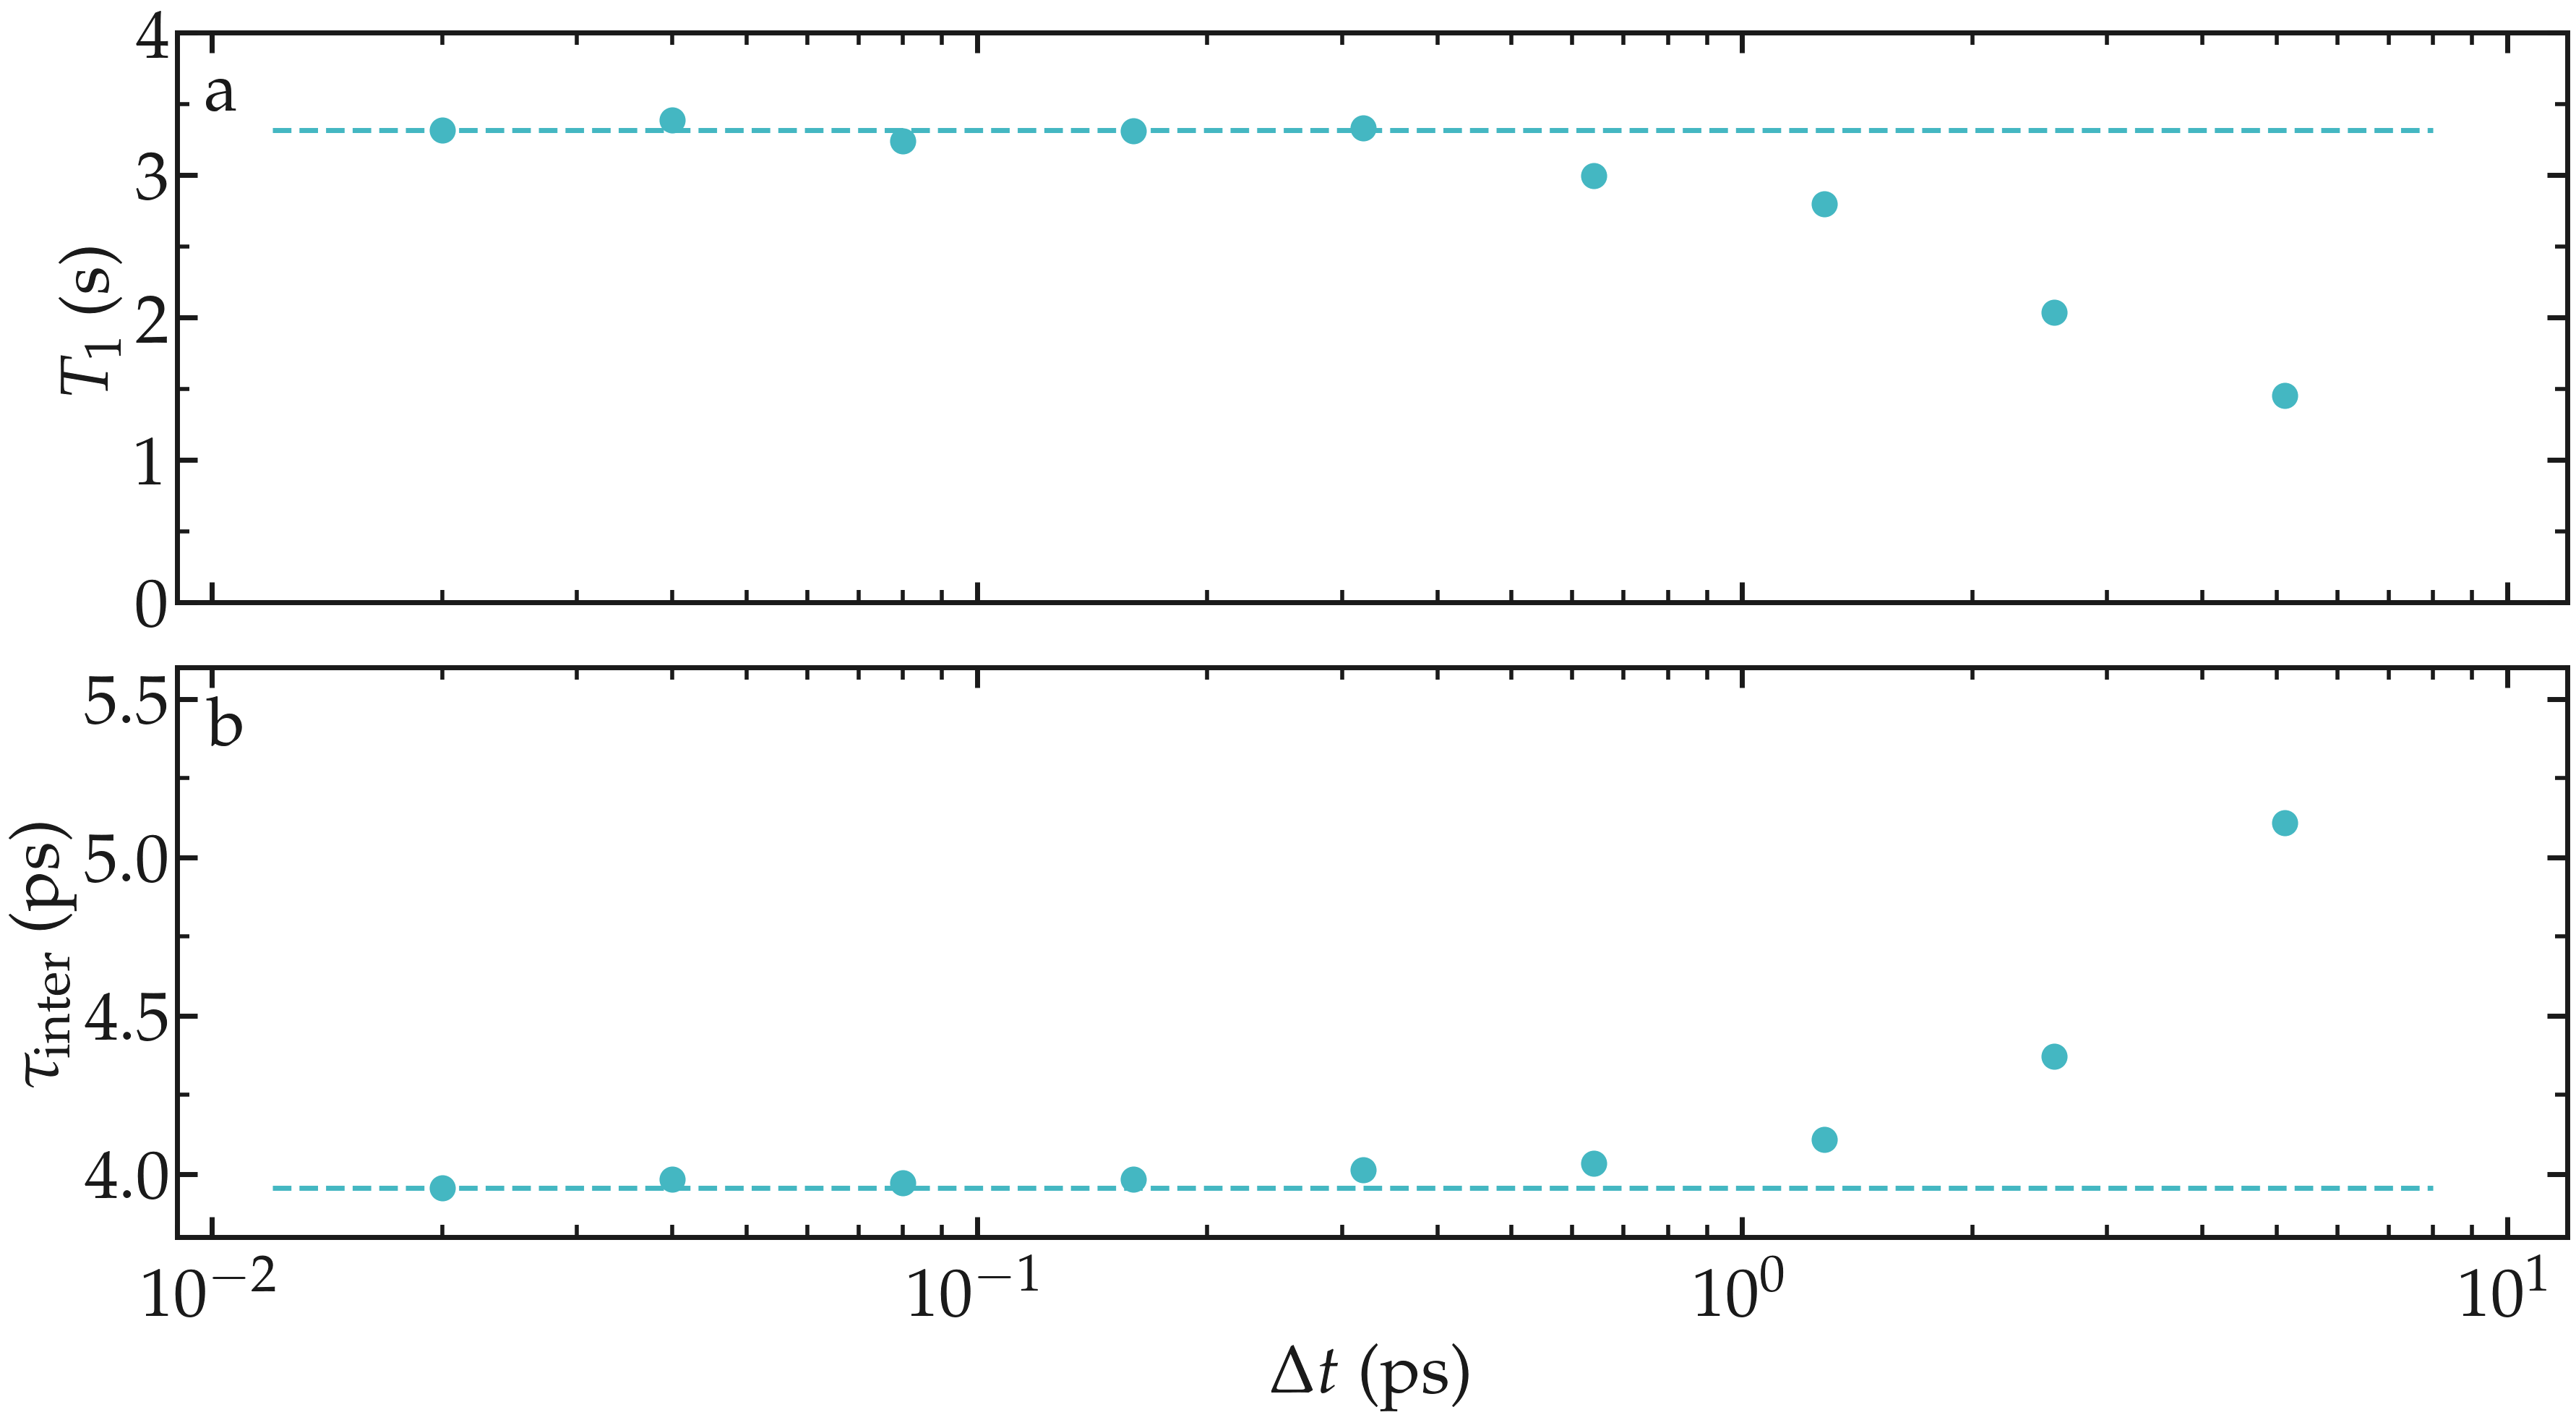
Figure: a) Convergence testing showing the NMR relaxation time \(T_1\) as a function of the trajectory dumping frequency \(\Delta t\) for a bulk water system at \(T = 300 \text{K}\). The dashed line show the value for \(T_1\) for \(\Delta t \to 0\). b) Inter-molecular relaxation times \(\tau_\text{inter}\) as a function of \(\Delta t\).